Insert a Graphs or Chart
Graphics are like pictures, they show in an easy and simple
way what you would have to explain in 1000 words.
To insert a graphic there a many ways to do it. Here the
simplest ways explained.
-
Click on CHARTS in the INSERT ribbon
. 
-
The following window will appear.
This window will allow you to chose whatever type of graph or chart
you think is the most suitable for what you want to say.
Once selected, an example of the graph will appear.
To modify this graph, you can use the CHART TOOL Ribbon,
DESIGN and FORMAT. They will let you change all the parameter of the
graphics.

To Modify the styles, fonts, colors, texts use the FORMAT
Ribbon. They are very straighforward to use. Select the part of the
graphics you want to modify and then click on the part of the Ribbon
this part has to change to.

- The second way to add a CHART is to click on the CHART icon on the
emplty slide.
-
By doing so, the same window will open and ask you which graph
you want. But the difference is that once the graph is selected, the
graph will appear centered in the slide.
Tips and Tricks 1
When you have X and Y coordinate date, like for exemple one
set of data is the time of the year and the other is the number of items you
sold in your shop, then use the XY scatter chart. The others are not
suitable.
Tips and Tricks 2
Your charts might not give the right message sometimes. May
be if you inverted the two axes, it would look totally more readable. Try
this...
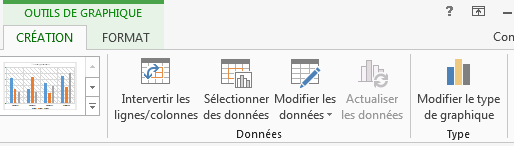
Click on your Chart and in the Chart Tools Design Ribbon,
click on the SWTCH ROW and COLUMNS.